

CUSTOM DASHBOARDS · REPORTING PORTALS · DATA INTEGRATIONS
Dashboard & Reporting Tool Development
For teams replacing spreadsheet reporting, slow dashboards and disconnected operational data with secure tools built around real decisions.

<2s
IKEA dashboard load time
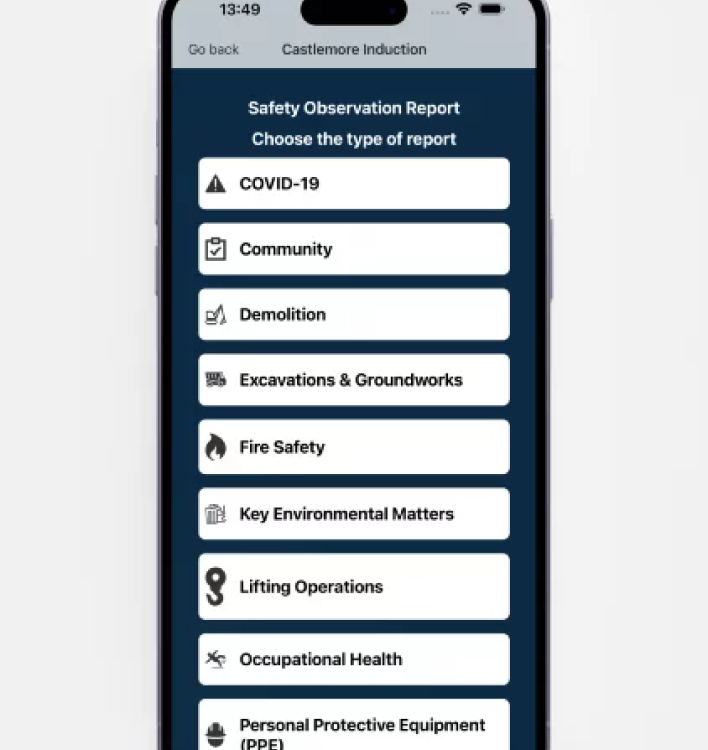
TSL inductions supported


When reporting starts slowing the business down
Dashboards become business-critical when leadership, operations or client teams can no longer rely on static exports, manual spreadsheet updates or data hidden across different systems.
- Reports depend on one person or one spreadsheet
- Managers cannot see real-time operational status
- Compliance records are hard to audit
- Customers, contractors or partners need controlled access to data
KPI dashboards
Operational, finance, site, workforce or leadership views tailored to the decisions your team makes every day.
Reporting portals
Secure access for clients, contractors, patients, partners or internal teams with role-based permissions.
Data integrations
Connect apps, CRMs, ERPs, databases, spreadsheets and APIs into one reliable source of truth.
Audit trails
Build reporting around approvals, records, compliance evidence and exports instead of loose files.
Dashboard and reporting proof

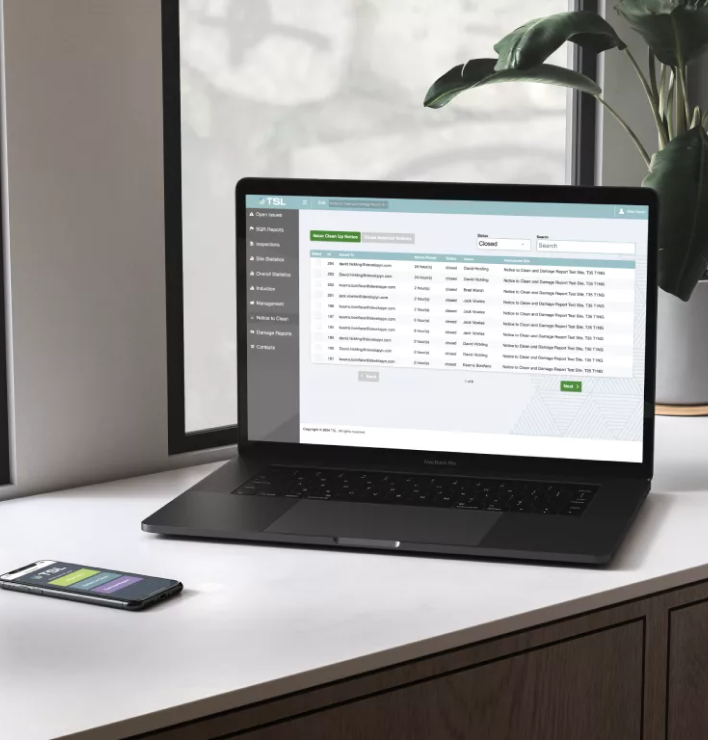

How we build reporting tools
Map
Data, users and decisions
We identify what needs reporting, where the data lives, who needs access and what decisions the dashboard must support.
Design
Clear dashboard UX
We turn complex workflows into focused interfaces, reports, filters and views that match each user’s role.
Connect
Systems and integrations
We connect apps, databases, spreadsheets, APIs and cloud services so reporting is reliable and repeatable.
Secure
Permissions and auditability
We build role-based access, audit trails and safe data handling into the platform from the start.
Launch
Tested reporting accuracy
We test outputs against your real data and help teams adopt the dashboard without losing operational continuity.
Improve
Support and iteration
Dashboards evolve as operations change. We support future reports, integrations and product improvements.
Dashboard & Reporting Tool FAQs
How much does a custom dashboard cost?
Every dashboard project is different because the right cost depends on the number of data sources, user roles, integrations, chart complexity and reporting requirements. Developyn is usually the right fit when your project budget is over £10k — particularly for KPI dashboards, reporting portals and operational tools that need to replace spreadsheets or disconnected systems.
How long does it take to build a reporting dashboard?
Timeline depends on data complexity and scope. A focused operational dashboard feeding from one or two data sources can typically be delivered in 4–8 weeks. Larger portals with multiple integrations, user roles and compliance requirements may take 12–16 weeks. We structure work in agile sprints so you see progress and can adjust priorities as we build.
What data sources can you connect?
We connect to databases (PostgreSQL, MySQL, SQL Server), cloud services (AWS, Azure, GCP), APIs, CRMs, ERPs, spreadsheets and flat files. If your data lives somewhere with an API or structured export, we can build a reliable pipeline into the dashboard.
Can you build mobile-friendly and multi-user dashboards?
Yes. We build responsive dashboards that work on desktop, tablet and mobile. We also add role-based access so site managers, directors, clients, contractors or compliance teams each see the views and data they need — and nothing they should not.
Do you provide support after the dashboard is launched?
Yes. We support dashboards after launch including bug fixes, hosting support, data pipeline maintenance, new integrations, additional reports and feature development. Dashboards evolve as operations change, so ongoing support keeps them aligned with real decisions.
Do you build dashboards using Power BI or Tableau?
We build custom web-based dashboards using modern frontend frameworks (React, Vue, Svelte) with charting libraries tailored to your data. This gives you full control over design, interactivity, data pipeline and hosting without per-seat licensing. If you already use Power BI or Tableau, we can integrate your reporting tools into a broader portal or complement them with custom operational dashboards.
Need to automate the workflow behind your reporting?
Dashboards are often most valuable when they are connected to a wider operational system. See our workflow automation software development page if your reporting depends on manual admin, spreadsheet updates or disconnected tools.
CONTACT US
Talk To Our Team
Tell us what you currently report on, where the data lives, and what decisions are being slowed down.